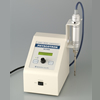
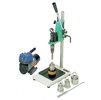
Zeta Potential Analyzer: ZEECOM software
TOP > Products > Zeta Potential Analyzer
Measurement modes
You can select zeta potential measurement modes depending on the electrophoresis condition of your sample.
Automatic measurement
In automatic measurement mode, individual particles are automatically recognized. All you have to do is to specify the number of particles and time, and zeta potential is automatically measured.
You can check the electrophoresis migration of individual particles on a monitor. Automatic measurement mode is suited for massive dataacquisition.
Manual measurement
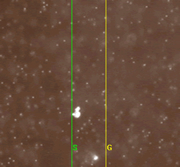 In
manual measurement, you track the particle migration on a monitor.
First of all, you set start and goal lines. When the particles pass the
start and goal lines, click a mouse button. Data are collected by repeating
the above procedure. Then, the zeta potential of individual particles are
measured.
Manual measurement is suitable for the samples below:
- Particles with heady settling and rising motion
- Particles with heady Brownian motion or flickering due to irregular shape
- Sample with several kinds of particles mixed
- Remeasurement the specific particle from archive images
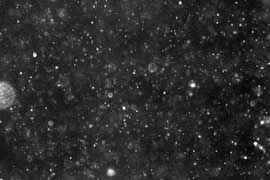
Movies of particles undergoing Brownian motion or electrophoresis migration
Zeta potential and particle size measurements are performed with real time observation of particles.
| Brownian motion or electrophoresis migration in a solution (Movies will pop up by clicking the images.) |
|
|---|---|
 |
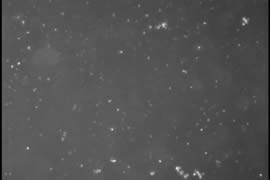 |
| Silver colloid particles (10-20nm) undergoing Brownian motion (10.5MB) Sample provided by Tanaka Precious Metals Co., Ltd. TEM image of the samle (PDF 453KB) |
Setteling kaolin (5-10µm) in the electrophoresis (912KB) Sample provided by Wako Pure Chemical Industries, Ltd. |
Examples of zeta potential analysis modes
Particles with a size of 20nm to 100µm(*) are measurable.
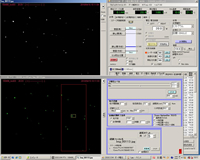 |
In ZEECOM, sample solution is inlet in our own developed electrophoresis cell. By irradiating the sample cell, dispersed particles in a solution are brightened and displayed on a monitor through a microscope. Then by tracking electrophoresis particles, their mobility and zeta potential values are calculated. By using laser light with high scattering intensity for light source, particles with a size of 20nm(*) can be observed. (*) Depending on particles, in case the difference in refractive index between particle surface and solvent is small, it may be difficult to observe particles on the monitor. |
| Automatic measurement mode: Image analysis software recognizes individual particles and track their migration. |
Data acquisition of individual particles & histogram display
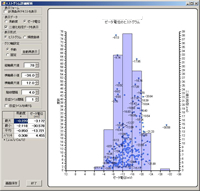 |
In ZEECOM, the software records the zeta potential values of INDIVIDUAL particles.They are NOT just average values or distribution of particles. Saved zeta potential data can be output as CSV file
(.csv). Also, in case primary particles and secondary particles
are mixed, they can be distinguished on the monitor. |
Zeta potential
histogram of individual particles |
